Introduction
This package can be used to simulate scenarios of wind power forecasts from actuals and vice-versa. It has been implemented so that a generalization to any source of uncertainty providing actuals and forecasts, is possible.
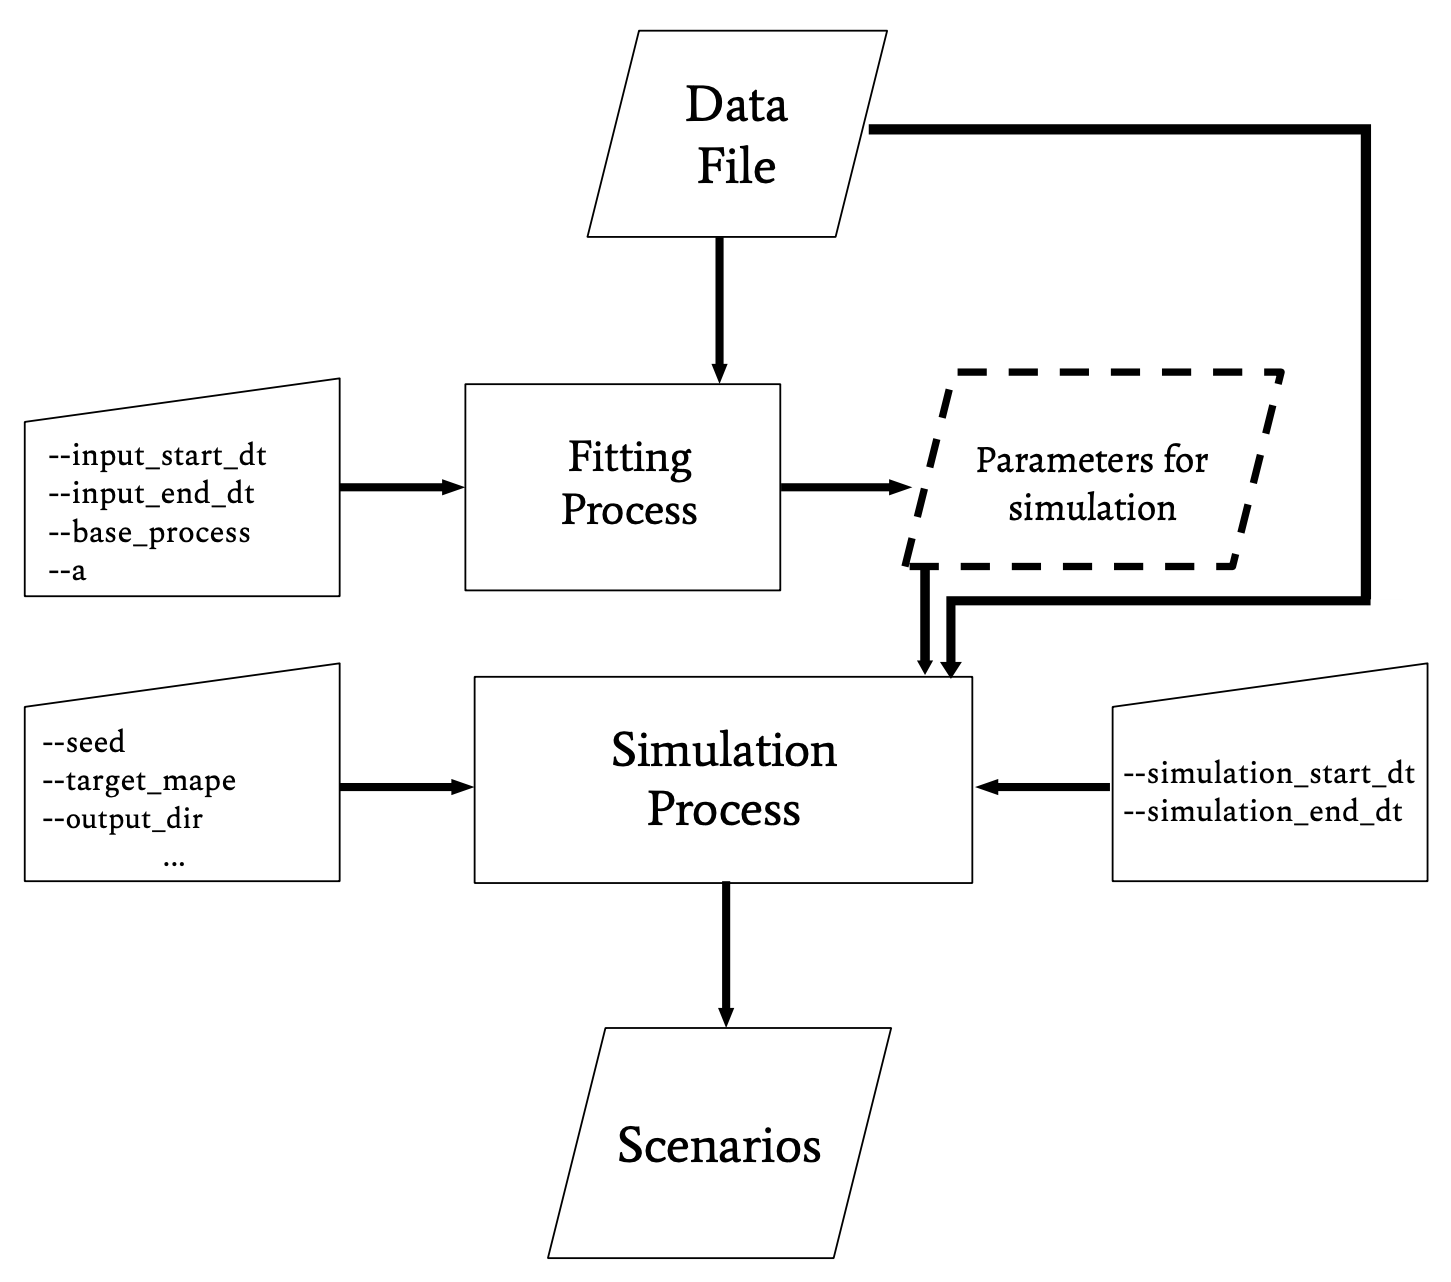
The main inputs of the package are :
- an input dataset giving forecasts and actuals for specified datetimes as a csv file (see more at Input).
- a simulation input dataset (sid) giving at least one of the two columns (forecasts or actuals) for specified datetimes as a csv file. It can also be a subset of the input dataset, specified by a start and end-date. By default, the sid is the input dataset (see more at Options).
- r_tilde : a desired MAPE (i.e mean absolute percent error see more at Percent Errors and MAPEs) for the simulations in output
- user-specified technical parameters (see more at Options).
The mape_maker class estimates the conditioned distribution of the errors considering the input values. It adjusts these distribution to satisfy the specified target MAPE. Having fitted a base process, it simulates highly auto-correlated errors and finally if the user specifies it, it operates a curvature optimization. This approach will yield “plausible” scenario sets (see more at Plausibility objectives).
Percent Errors and MAPEs
We denote f and a as respectively the timeseries of forecasts and actuals. From there we can define two MAPEs depending on the simulation you wish to accomplish.
Then if you are simulating forecasts from actuals,
If you are simulating actuals from forecasts,
Plausibility objectives
- A scenario set is said to be “plausible” if :
- the shape of the distribution of the scenarios errors is close to the shape of the empirical distribution of errors;
- the computed auto-correlation coefficients for the set are close the empirical values;
- the computed curvature for the set is close to the empirical value, especially when the scenarios are forecasts.
Setup
The package is compatible with Python version 3 or higher only. The user is expected to have installed pyomo before running the package. Go to http://www.pyomo.org for more information.
- Switch to a proper directory and then type:
git clone + https://github.com/mape-maker/mape-maker.git
- Install the package with the setup.py file:
python setup.py develop
- For a quick-first run :
python -m mape_maker "mape_maker/samples/wind_total_forecast_actual_070113_063015.csv"
- If you want to optimize the curvature, you need to install a Quadratic MIP solver such as “Gurobi”: http://www.gurobi.com (e.g Gurobi, Cplex, SCJP, etc.)
Notes about the Input File
If you want to use your own datafile as an input to run the mape_maker, then the input file format should be:
- “datetime” as the first column, formatted as ‘Y-M-D H:M:S’. i.e: 2020-01-01 01:00:00
- “forecasts” data as the second column, format as “float”. i.e: 3264.59
- “actuals” data as the third column, format as “float”. i.e: 3264.59
If the forecasts and actuals throughout the dataset are the same numbers up to most of the decimal points, then the software will not run the scenarios. This is the case because then there is little to no relative error, which leads to invalid values for r_tilde.
If the input datafile has any missing values, then the program will terminate with a KeyError warning.
Summary of the Algorithm